


Radio Geek
Building a simple inductance meter (Part 2)

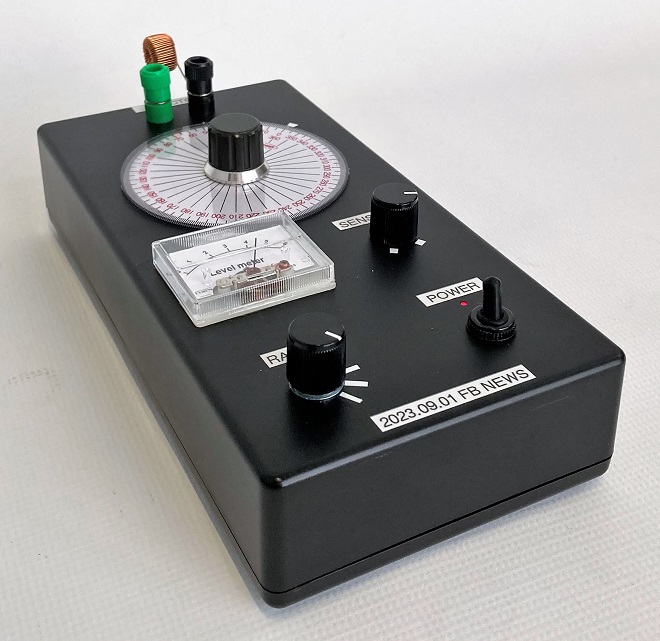
Completed simple inductance meter.
I discussed how to determine the inductance in Part 1 of the previous issue, and I will proceed with the LC parallel resonant circuit method as described in the previous issue.
Circuit diagram of the inductance meter to be fabricated
Figure 1 shows a block diagram of a simple inductance meter using the LC parallel resonance circuit, as shown in the previous article. Figure 2 is a circuit diagram conceived along this block diagram. I try to avoid using special parts and use parts that are readily available in the market.
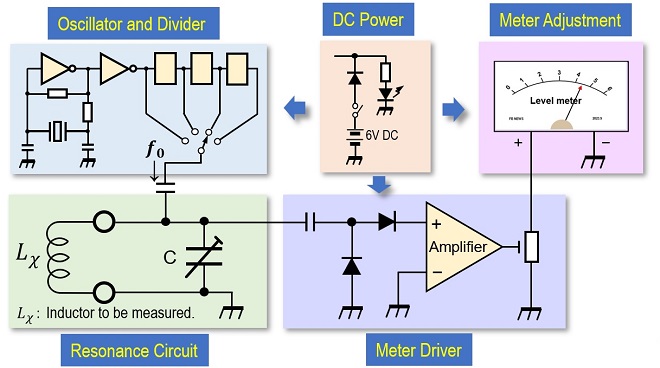
Figure 1. Block diagram of the simple inductance meter.
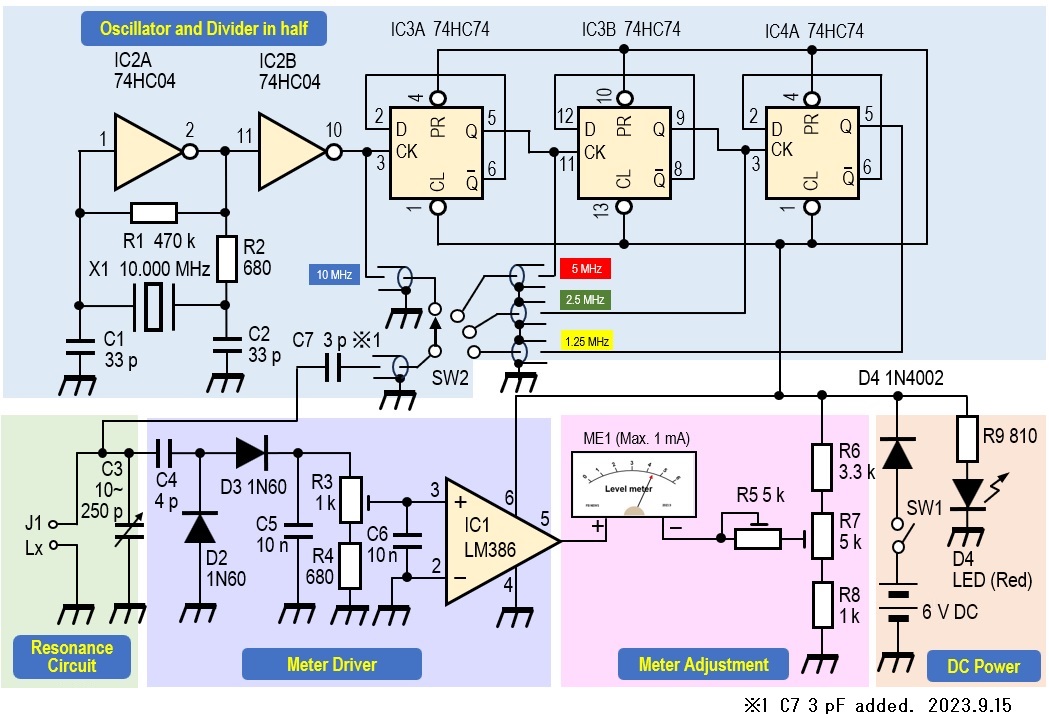
Figure 2. Circuit diagram of the simple inductance meter.
Circuit Description
(1) Oscillation circuit
X1 (10 MHz) crystal unit is oscillated by IC2 (74HC04) inverter. This 10 MHz crystal unit is not a special component, so it can be obtained at a parts store or through online stores. The 10 MHz signal is divided in half with IC3A (74HC74), then in half again by IC3B, and then once again in half with IC4A to obtain signals of 5 MHz, 2.5 MHz, and finally 1.25 MHz, respectively. The divided signal is switched by SW2 (Rotary switch) and fed to the resonance circuit consisting of Lx and C3.
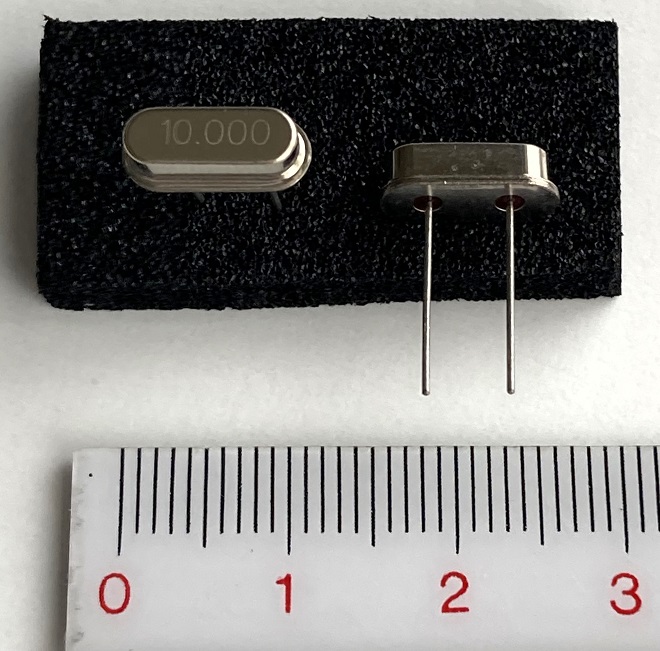
Figure 3. 10 MHz crystal oscillator unit.
One thing to note in the circuit is the 74HC04 logic IC used for oscillation. To use a 74HCU04 is of course OK, but even with inverters, the 7404 of the TTL type I used so often in the past did not oscillate.
(2) Resonance circuit
Lx shown in the circuit diagram (Figure 2) is the inductance to be measured. C3 is connected in parallel with Lx to form an LC parallel resonance circuit. The variable capacitor in Figure 4 is what I used in this project.
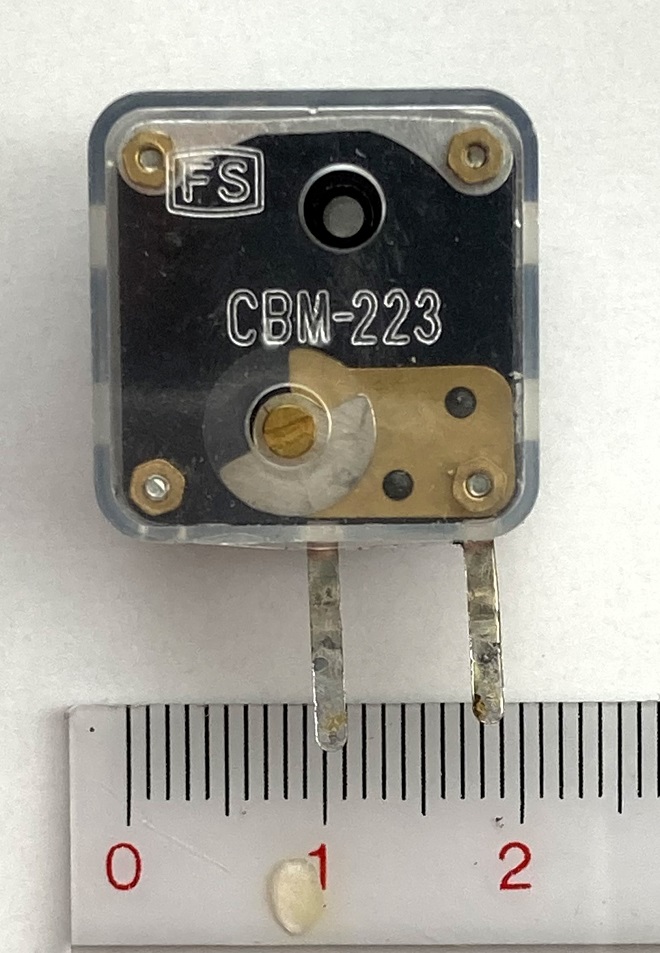
Figure 4. Variable capacitor, familiar from germanium radios.
The variable capacitance range is considered to be approximately 10 pF to 250 pF, and these values were used in the calculations for this project. When an RF (Radio Frequency) signal is applied to the resonance circuit composed of Lx and C3, and the circuit resonates at that frequency, the voltage at both ends of the resonance circuit increases. This signal is used to drive the meter in the subsequent stage. The signal is sent to the meter drive circuit through C4.
(3) Meter drive circuit
The RF signal input through C4 is converted to direct current by the rectifier circuit of D2, D3, and C5, and then amplified by IC1 (LM386) to a signal that makes the meter swing. 2.6 V, about half the supply voltage, is output at pin 5 when no signal is applied to pin 3 of IC1. When Lx and C3 resonate, the signal applied to pin 3 is amplified by IC1 and output from pin 5. This voltage will unbalance the meter circuit and the meter will swing in proportion to it.
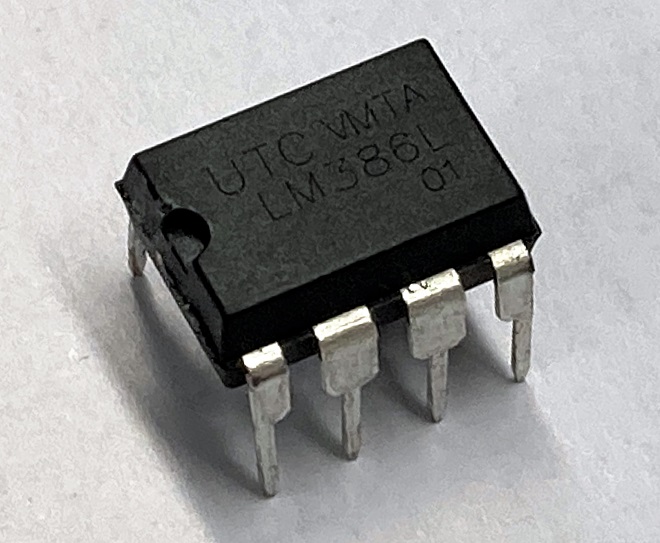
Figure 5. LM386 is used as a meter drive circuit.
(4) Meter display circuit
There is no problem in using a measurement ammeter for the meter, but any meter with a full scale of 1 mA or less is acceptable, especially since this part of the meter is not intended to accurately read absolute values of current or voltage. In this project, I used a meter about the size of an indicator in a plastic case. The degree of meter swing depends on the sensitivity of the meter, but it can be adjusted with R5 and R7. On the dial of the meter, a scale like the one in Figure 6, which was made on a PC, is pasted to make it look like a meter.
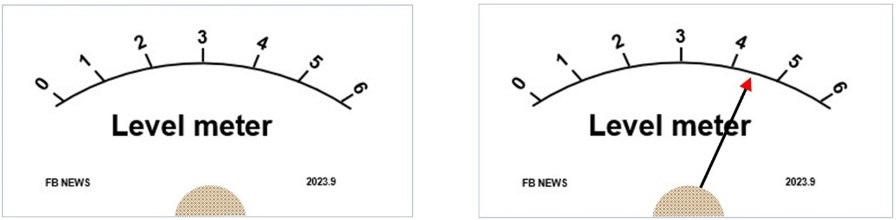
Figure 6. Scale to be pasted on meter dial.
Internal circuit board (circuit board)
Figure 7 shows the components shown in the circuit diagram assembled on a 7 cm x 9 cm universal PC board. Since external components such as meters and switches are mounted on the panel surface, a relatively large 22 cm x 11 cm x 4.5 cm plastic case is used.
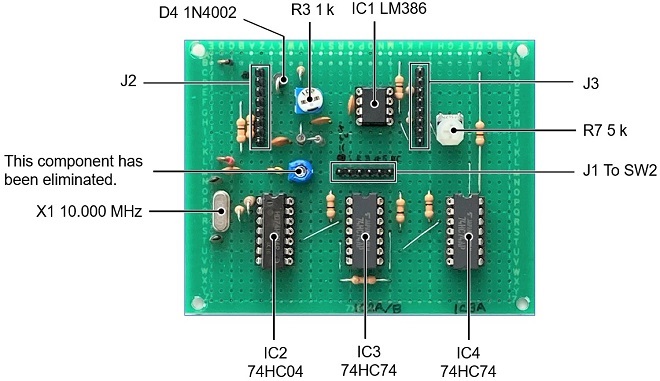
Figure 7. Schematic components assembled on a 7 cm x 9 cm universal PC board.
Assembly
The following parts are mounted on the panel surface.
(1) Power ON/OFF switch and a power indicator (LED).
(2) Variable capacitor for resonance circuit.
(3) Rotary switch for selecting an inductance range.
(4) Control pot. to adjust meter sensitivity.
(5) Meter for finding a resonance point.
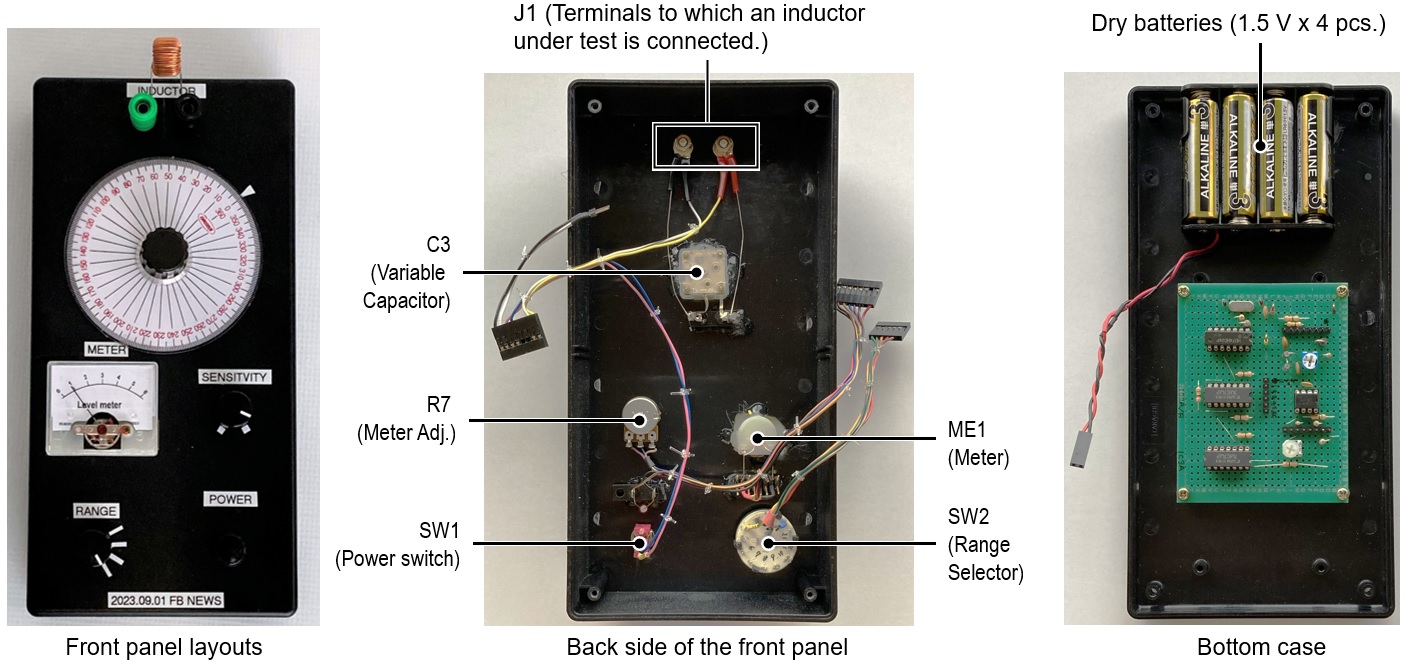
Figure 8. Panel layouts and inside view of the panel with installed parts.
The protractor shown in Figure 9 (left) is like one we usually see. The A circular protractor as shown in Figure 9 (right) is used for the scale plate directly connected to the variable capacitor. Since the case is black, it is difficult to see the scale on the dial if it is installed as it is, so white cardboard is attached to the back side.
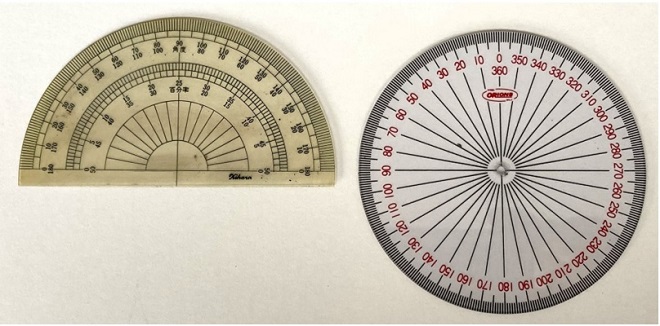
Figure 9. Scale plate using a circular protractor (right).
Operation check
To check the inductance meter operation, use the table in Figure 10 obtained by doing the following steps in the order.
(1) Prepare as many known inductors as possible.
(2) Select an inductor in each frequency range according to the table in Figure 11.
(3) If f0 is in the range of 2.5 MHz, an inductor should be between 16 µH and 400 µH.
(4) Connect the prepared inductor to the connection terminal.
(5) Turn ON the power. The red LED will light up.
(6) Adjust the SENSITIVITY so that the meter pointer becomes about 50% of full scale.
(7) Turn the tuning knob slowly to find the resonance point.
(8) The meter will gradually increase in amplitude until it reaches its peak.
(9) Turn the tuning knob further, and the meter pointer will decrease again.
(10) This peak point is the resonance point at that frequency.
(11) Do the same for the other frequency ranges to confirm the resonance point.
(12) If the resonance point can be found in each frequency range, the unit works normally.
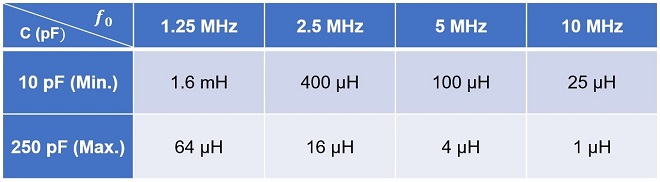
Figure 10. Approximate measurable range of inductance in each frequency range.
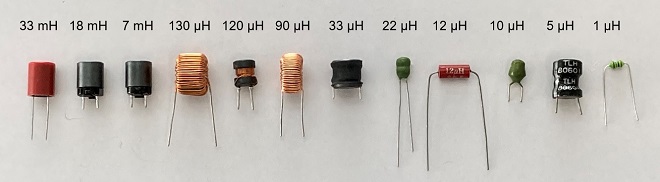
Figure 11. Various inductors purchased at a parts store.
Adjustment
As explained in Part 1 of this article, I assumed 10 pF for the minimum capacitance. The maximum measured inductance is 1.6 mH when f0 is set to 1.25 MHz in the table in Figure 11. Therefore, the leftmost three inductors shown in Figure 12 are larger than 1.6 mH and cannot be measured.
Calibration of the tuning knob's scale plate begins by connecting the inductors near the upper and lower limits of each frequency range to the terminals and finding the respective peak points. As shown in Figure 11, for the 2.5 MHz frequency range, I calculated that the measurement range is 400 µH when the capacitance of the variable capacitor is 10 pF and 16 µH when it is 250 pF. Connect the 130 µH and 33 µH inductors, respectively, and turn the tuning knob to find the peak point. Since the difference between 130 µH and 33 µH is about 100 (130-33≈100), divide the scale between them into 10 equal parts to obtain the scale of the inductance value in the 2.5 MHz range.
In the table in Figure 13, the letters in brown are actual measured values with prepared inductors. The numbers in black in the table are calculated values. Blank columns are not measured due to lack of suitable inductors. Although I do not know if the scale of the protractor and the capacitance of the variable capacitor are in the linear scale, I can estimate the approximate inductance from this table.
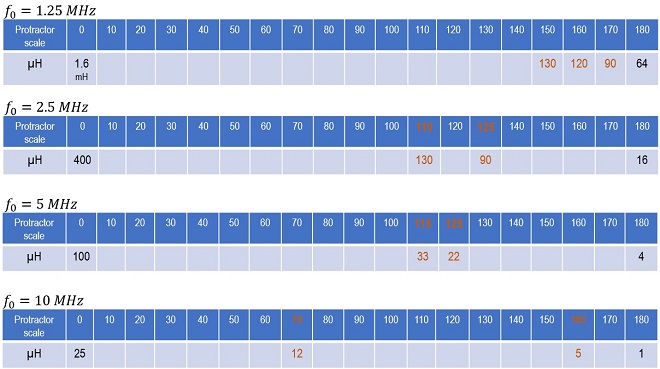
Figure 12. Measured values of simple inductance meter.
Consideration
For an inductor with a high Q, it is relatively easy to find the peak by turning the tuning knob while watching the meter. But for the inductors shown on the right side of Figure 12, the Q is low, and the peak did not appear in the shape of Mt. Fuji. Still, if you carefully turn the tuned circuit, you can find a faint peak and get a rough but approximate idea of the inductance.
A crystal oscillates at 10 MHz, from which signals of 5 MHz, 2.5 MHz, and 1.25 MHz are created using a logic IC. Coaxial cables were essential for the transmission of these signals. Initially I used to wire with ordinary wires. These four RF signals were designed to be switched by the rotary switch, but because the signals to be switched were RF signals, they could not actually be switched. As a result, they could not be tuned. As shown in the circuit diagram in Figure 2, the use of coaxial cables is recommended for transmission of RF signals.
The building of this product still has room for improvement. It is not a batch inductance meter like the ones on the market, but I managed to make what I call a simple inductance meter. If I have a chance, I would like to improve it and contribute to this corner again.
CU
Radio Geek backnumber
- Making a 10-second IC Recorder for copying super-fast CW
- Making sequential turn signals
- Simple Electric Field Strength Meter with LED Display (Part 3)
- Simple Electric Field Strength Meter with LED Display (Part 2)
- Simple Electric Field Strength Meter with LED Display (Part 1)
- Again, building a simple inductance meter (Part 2)
- Again, building a simple inductance meter (Part 1)
- Building a simple inductance meter (Part 2)
- Building a simple inductance meter (Part 1)
- Project No.5 Upgrading the counter to 4-digits
- Project No.4 Making a push-up counter
- Project No.3 Making an Up/Down counter (Part 3)
- Project No.2 Making an Up/Down counter (Part 2)
- Project No.1 Making an Up/Down counter (Part 1)