


Radio Geek
Simple Electric Field Strength Meter with LED Display (Part 3)
Completed the simple electric field strength meter with LED display
In this issue, I will incorporate the circuits experimented with in Part 1 and Part 2 into a universal printed circuit board and place them in an aluminum case to complete the final stage at once. Figure 1 shows an overall diagram of the circuit obtained from the experiments conducted so far. Some components have been slightly modified from the circuits shown in Part 1 and Part 2.
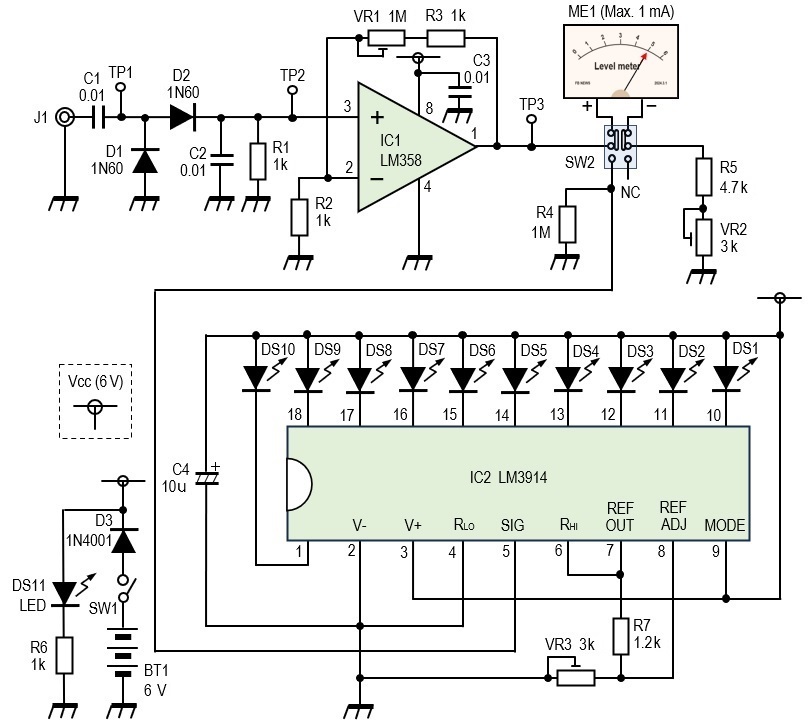
Figure 1. Full circuit diagram
Circuit Description
(1) Detection circuit
J1 is a connector to connect a receiving antenna. Any connector can be used since it is simply for receiving RF signals. Here I used a BNC connector. D1 and D2 are 1N60 germanium diodes. The use of germanium diodes is a key point to improve sensitivity. The voltage called the junction potential difference, or forward voltage drop, (VF) of the diode is about 0.7 V for silicon diodes and about 0.2 V for germanium diodes. For this reason, the germanium diode is more sensitive than the silicon diode for detecting signals.
(2) Detector signal amplification circuit
LM358 (IC1) is a general-purpose operational amplifier. This IC is used to configure a non-inverting amplifier to greatly amplify a weak signal (VIN) input to pin 3. The relationship between the input (VIN) and output (VOUT) of the non-inverting amplifier circuit can be expressed by the following equation.
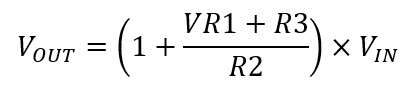
Substitute the values of the resistors used in the circuit into the above equation and calculate the amplification (AV) in parentheses ( ). VR1 is a 1 MΩ variable resistor. When VR1 is set at 1 MΩ, AV ≈ 1000 times, and when VR1 is set at minimum for zero Ω, AV = 2 times. If the input signal is amplified 1000 times in the amplifier circuit, even if VIN = 1 V, VOUT will be 1000 times and it becomes 1000 V in the calculation. However, the output voltage will not be higher than the power supply voltage in reality.
(3) Meter display circuit
A needle-type meter is not particularly necessary when using an LED-display electric field strength meter. In this case, I installed the meter because I wanted to observe the detailed movement of the input signal. The meter is switched using a 6P (3 positions and 2 circuits) slide switch. The needle-type meter uses an ammeter with a maximum value of 1 mA. An expensive ammeter is not necessary because it only indicates the strength of the signal. The values of R5 and VR2 in the circuit diagram depend on the ammeter used, but for a 1 mA ammeter, the values shown in the circuit diagram should be sufficient.
(4) LED display circuit
The circuit composed of IC2 is an LED display circuit using the LED display driver (LM3914) introduced in Part 1. The data sheet for the LM3914 notes that if the wiring between the LED and IC is longer than 6 inches (about 15 cm), C4 must be installed. In this assembly, the wiring is not that long, but I installed a 10 μF electrolytic capacitor just to be safe.
The signal strength is indicated by four different colored LEDs. The LEDs DS1 to DS10 light up sequentially according to the signal strength input to pin 5 of IC2. VR3 is a 3 kΩ variable resistor to adjust the input signal level and the number of LEDs lit. As explained in the last summary section, the brightness of the green, yellow, and red LEDs is not so high in bright outdoor environments, so the use of blue LEDs with high brightness is recommended.
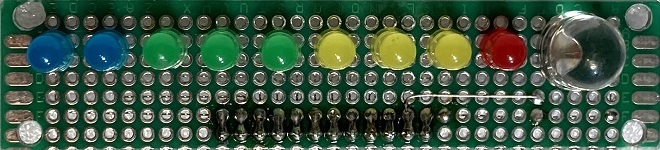
Figure 2. LED display board
When SW2 is switched to the needle meter side, pin 5 of IC2 is in a floating state without any input signal, which may cause the LED display to malfunction. For this reason, a pull-down resistor (R4) is installed on the pin 5 input line.
(5) Power supply circuit
The unit is designed to operate on batteries so that it can be used in the field. For this building, 6 V is obtained from four AAA batteries. Although I do not expect the batteries to be inserted backwards, I have installed D3 as a protection diode just in case. Therefore, the voltage applied to IC1 and IC2 is 5.3 V, about 0.7 V lower than 6 V.
Building
The unit is built into a 150 x 100 x 40 mm aluminum case. Figure 3 shows the external components built into the chassis.
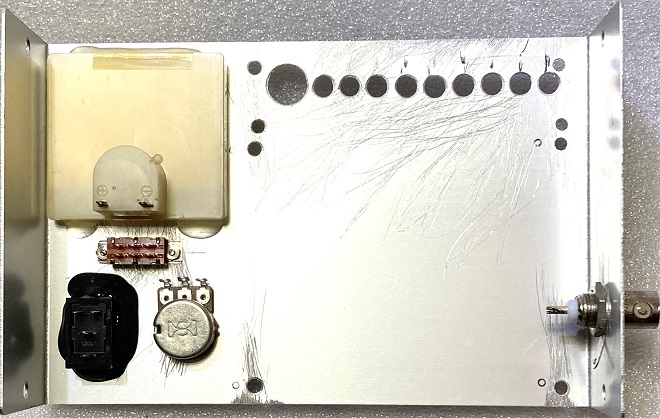
Figure 3. External components assembled in a machined aluminum chassis
The circuit shown in Figure 1 is built by dividing it into two circuits, the display circuit and the main circuit. Each board is assembled into the aluminum case shown in Figure 4.
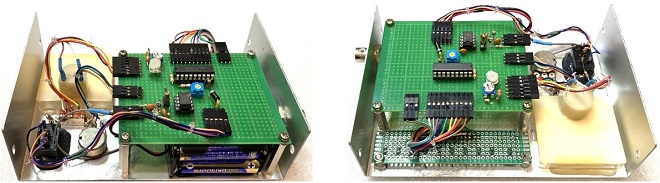
Figure 4. Internal structure incorporating two boards and peripheral components
Adjustment and operation check
(1) Adjustment of VR2
Adjust the needle meter. Create a state where the input signal is very large. In this state, Pin 1 of IC1 outputs a 4 to 5 V signal. To make the 1 mA ammeter read full scale at this signal level, a 5 kΩ resistor should be installed in series with the ammeter. Therefore, R5=4.7 kΩ and VR2 is set as a variable resistor of 3 kΩ for fine adjustment of full scale.
(2) Adjustment of VR3
Next, adjust VR3 (variable resistor) by relating the amount of change in the antenna input signal to the number of LEDs lit. As with VR2, the antenna input signal should be very large. At this time, turn VR3 so that all 10 LEDs light up at the maximum.
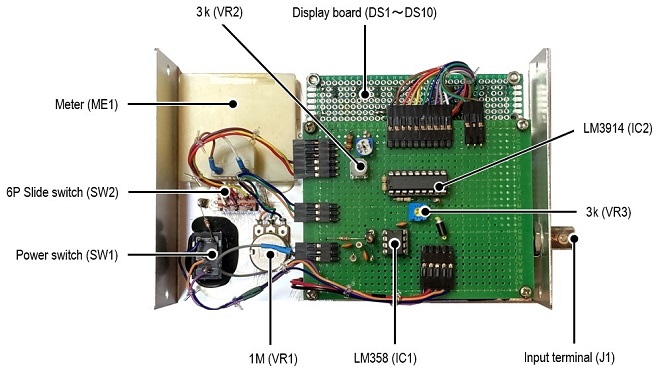
Figure 5. Inside view and location of each key component
Summary
I had thought that in the 430 MHz band, the characteristics of the diodes for detection, D1 and D2 would not be able to keep up with the higher frequency band and the meter sensitivity would drop significantly, but this unit was found to operate well from the HF to UHF bands.
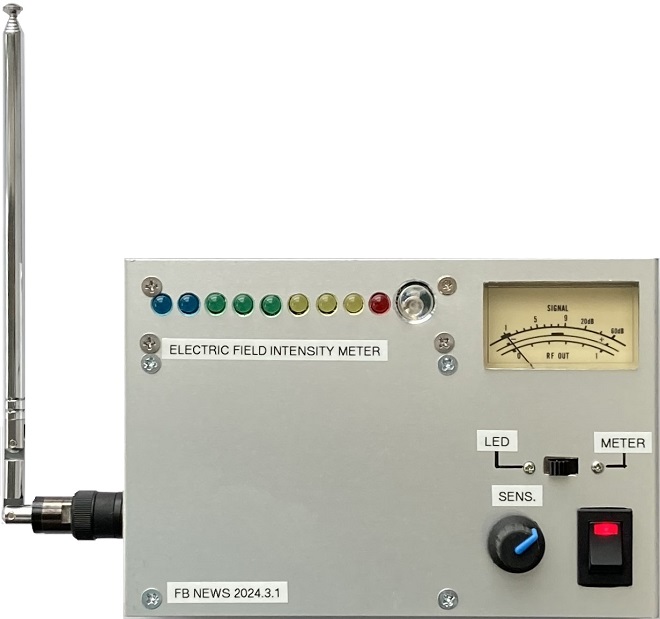
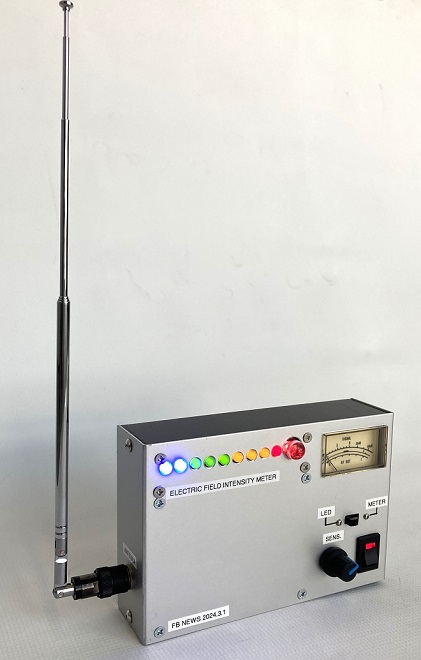
Figure 6. Front panel of the completed simple electric field strength meter
Turn the sensitivity "SENS." adjustment knob clockwise to maximize the sensitivity of the meter. To temporarily check the operation of the completed unit, an Icom ID-51 VHF/UHF handheld transceiver was used as the transmitting radio. The supplied flexible antenna was connected as the antenna. When the transceiver was set to 5 W RF output power in the 144 MHz band and transmitted, the LED lights could be seen even when the transmitter and receiver were about 30 meters apart. The receiving antenna was a simple telescopic antenna with a maximum length of 55 cm, as shown in the photo in Figure 6. The antennas used at both ends had lower gain than a dipole. If the transmitting end is made into a directional antenna like a Yagi antenna, which is its original purpose, the antenna gain is high enough to be practical at distances of 30 meters or more.
As I found out through actual use in bright outdoor locations, green, yellow, and red LEDs are outshined by ambient brightness, and it is difficult to determine the strength of the radio signal from a distance of about 30 meters. It is recommended to avoid using LEDs of these colors. For LEDs to be used, it is recommended to use blue LEDs with high brightness or large sized LEDs.
Although the unit was completed, the LED color and other improvements still needed to be made, but the antenna adjustment, which was the first goal, proved to be doable by one person.
Reference
A video of the LED lighting changing depending on the signal strength has been uploaded to a saver. Click here to see the video.
CU
Radio Geek backnumber
- Making a 10-second IC Recorder for copying super-fast CW
- Making sequential turn signals
- Simple Electric Field Strength Meter with LED Display (Part 3)
- Simple Electric Field Strength Meter with LED Display (Part 2)
- Simple Electric Field Strength Meter with LED Display (Part 1)
- Again, building a simple inductance meter (Part 2)
- Again, building a simple inductance meter (Part 1)
- Building a simple inductance meter (Part 2)
- Building a simple inductance meter (Part 1)
- Project No.5 Upgrading the counter to 4-digits
- Project No.4 Making a push-up counter
- Project No.3 Making an Up/Down counter (Part 3)
- Project No.2 Making an Up/Down counter (Part 2)
- Project No.1 Making an Up/Down counter (Part 1)