


Radio Geek
Simple Electric Field Strength Meter with LED Display (Part 1)

After building a directional antenna, such as a Yagi antenna, the spacing between each element can be adjusted to maximize the antenna's characteristics. Adjustments are made by placing an electric field strength meter a few wavelengths away from the antenna on its directional side and watching the meter indication. Normally, one person is placed on the antenna side and one on the field strength meter side. In other words, at least two people are needed. For this reason, I plan to build a field strength meter that enables one person to adjust the antenna.
I will make a simple electric field strength meter with an LED display. This meter is not a lofty instrument that measures the electric field strength at a distance from the antenna in absolute values, but instead displays the relative strength of the electric field strength with an LED bar meter instead of a needle meter. The feature of this meter is that the LED lights indicate the strength of the electric field strength from a distance.
The article will be divided into three parts. In Part 1, I will experiment with an 18-pin IC chip, the LM3914 level meter, to see how the LED lights up in response to input voltages. In Part 2, I will make RF amplifier and Detector units that will serve as an electric field strength meter. In Part 3, the circuit boards created in Parts 1 and 2 will be assembled into a case to complete the project.
Block diagram
Figure 1 shows a diagram of the simple electric field strength meter with an LED display that will be built this time. The main unit consists of four major blocks. The first is the RF Amp. section, which receives signals radiated from the antenna and amplifies them to a level sufficient to light the meter and LEDs in the subsequent stages.
The second is the Detector section, which converts the RF signals into a DC signal by doubling and rectifying it. The third is the DC Amp section, which lights up the LEDs. And the fourth is the Display section, which visually displays the received signal level with a meter or the LEDs.
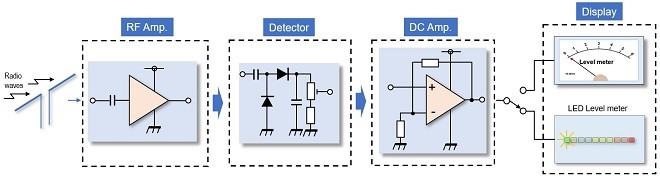
Figure 1. Block diagram of LED display RF level meter
LED Level meter
The LEDs are lit by an LM3914 IC. It is called an LED level meter or LED level driver by enthusiasts, but the Texas Instruments (TI) data sheet describes it as a Dot/Bar Display Driver. This IC detects analog voltage levels and turns ON 10 LEDs with linear characteristics. The resistance that determines the brightness of the LEDs can be adjusted collectively with an external resistor, eliminating the need to calculate the resistance for each LED.
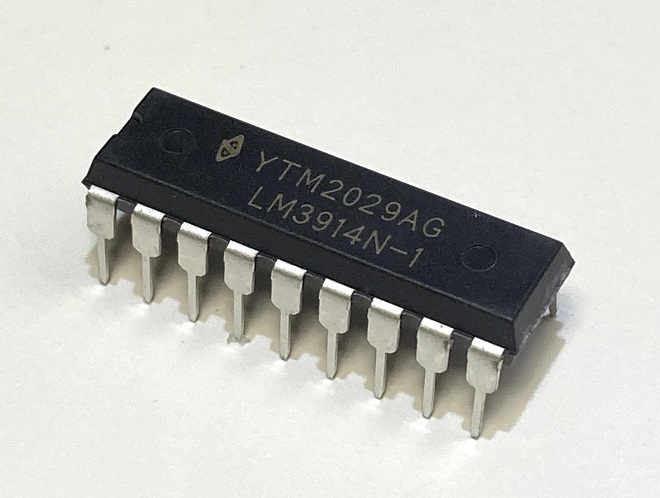
Figure 2. Appearance of LM3914N-1 (18-pin IC)
TI's data sheet lists a reference circuit for lighting 10 LEDs as TYPICAL APPLICATIONS. Assemble the circuit by referring to the diagram below. (Figure 3)
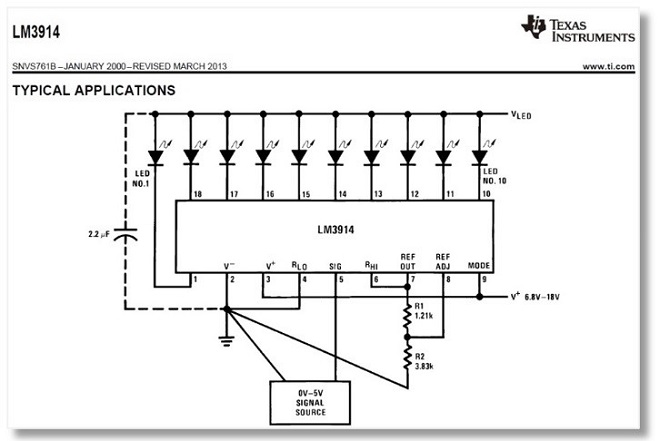
Figure 3. Reference circuit diagram from TI's data sheet (Quoted from TI's data sheet)
Calculating the resistance value that determines the lighting of an LED
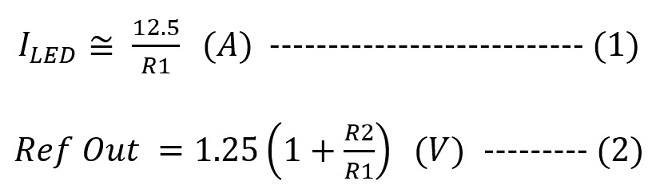
TI's data sheet shows how to calculate the current (ILED) that flows through an LED. The following equation is used to find the values of R1 and R2 in Figure 3.
1. Calculation of R1
The brightness depends on the LED used. In this case, I will use a so-called normal LED, as shown in Figure 4.
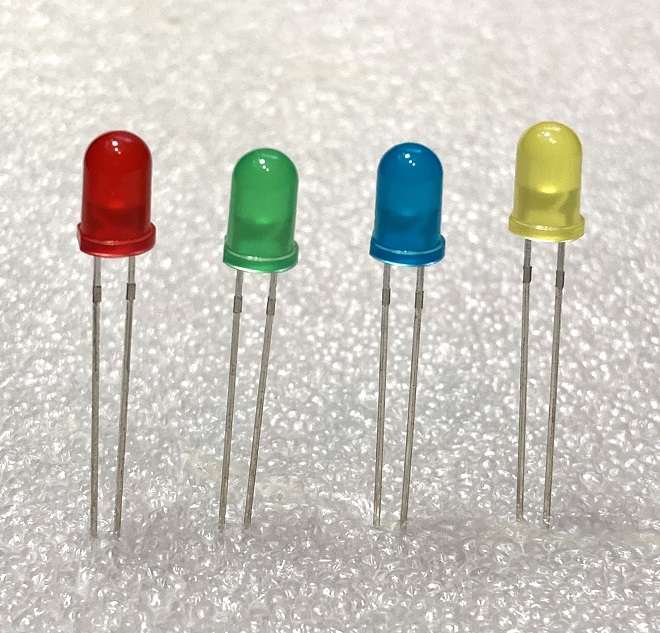
Figure 4. Ordinary LEDs that light up with a current of 10 to 20 mA
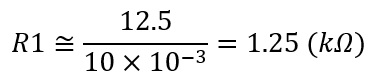
A current of about 10 to 20 mA is required to light the LED. 10 mA is assumed in this experiment. Substituting ILED=10 mA into the above formula (1), R1=1.25 kΩ can be calculated.
2. Calculation of R2
Find the resistor R2 that relates the change in input voltage to the number of LEDs lit. The input voltage here is essentially the voltage when the field strength meter receives a signal from the transmitter side through the antenna and converts the signal to a DC voltage. Since the field strength meter will be built from now on, I do not know how much the voltage will be at this stage.
The input voltage to the IC is largely related to the supply voltage (V+) that operates the IC. If the maximum input voltage is 5 V, the V+ applied to the IC must be at least 6.8 V. This is because the data sheet states that the voltage applied to the IC must be at least 1.8 V higher than the input voltage.
This field strength meter is intended to be battery-powered for outdoor use. Therefore, four 1.5 V dry cell batteries are connected in series to provide a power supply voltage of 6 V. Calculating backwards from this, when (V+) is 6 V, the maximum input voltage to the IC is 4.2 V (= 6 - 1.8). Based on the above, I proceed with the design assuming a signal level of 0 to 4.2 V to be applied to the input pins of the LM3914.
In Part 1, in order to test the lighting of the LM3914, I will calculate R2 so that the maximum of 10 LEDs will light up when the voltage changes from 0 to 4 V (≂ 4.2 V). The formula for obtaining R2 is the aforementioned formula (2). Formula (3) shown below is a variation of this formula to obtain the value for R2. The answer obtained by substituting the known information into this formula is R2=2.2 kΩ.
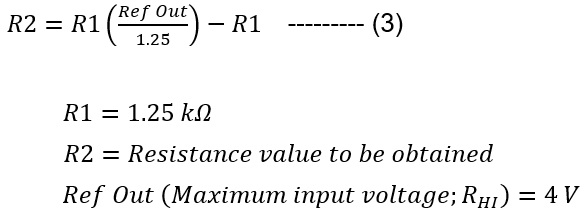
In other words, if a voltage of 0 to 4 V is input between the voltage input terminal SIG (pin 5) and GND of LM3914, when the input voltage is 0, none of the LEDs will light up. When the input voltage reaches 4 V, all the LEDs will light up.
Experimental circuit using LM3914
Figure 5 below shows the circuit for a lighting experiment. It is not a very complicated circuit, so there should be no problem even if it is suddenly incorporated into a universal board. First, I will build the parts on a breadboard and learn how the circuit works.
After assembling the parts on the breadboard, check the wiring carefully before adding 6 V to the circuit. Connect a variable 0 to 4 V power supply to the input terminal of the IC. If the number of LEDs illuminated changes according to the voltage, you are good to go.
The circuit diagram (Figure 3) in TI's data sheet includes a note about C1 (2.2 µF). If the LED leads to be connected are 6 inches or longer, a 2.2 µF tantalum capacitor or 10 µF electrolytic capacitor should be installed.
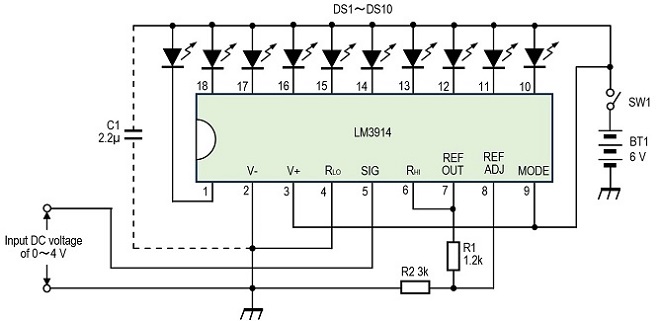
Figure 5. LED lighting experiment using the LM3914
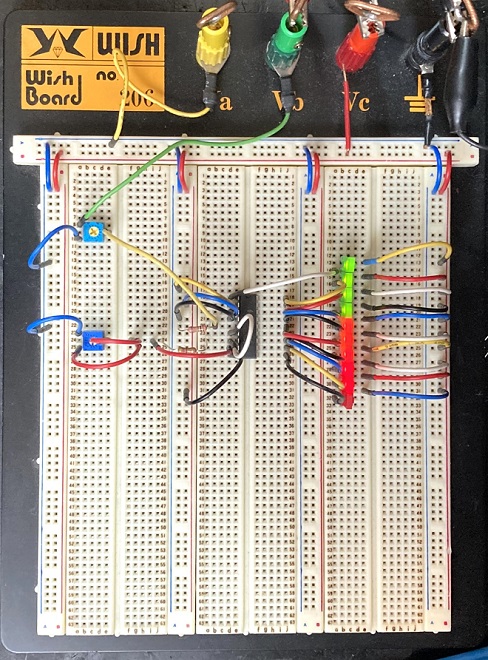
Figure 6. Learning how the LM3194 works by building the circuit shown in Figure 5 on a breadboard
Click here to see a video of the test built on a breadboard. Next, in Part 2, I will build a circuit that receives signals by the field strength meter and extracts a DC signal according to the strength of the signal.
CU
<Remarks>
Figure 3 in the text is quoted from the circuit diagram in the Texas Instruments LM3914 data sheet. Permission has been obtained from Texas Instruments.
LM3914 data sheet: http://www.ti.com/product/lm3914
Radio Geek backnumber
- Making a 10-second IC Recorder for copying super-fast CW
- Making sequential turn signals
- Simple Electric Field Strength Meter with LED Display (Part 3)
- Simple Electric Field Strength Meter with LED Display (Part 2)
- Simple Electric Field Strength Meter with LED Display (Part 1)
- Again, building a simple inductance meter (Part 2)
- Again, building a simple inductance meter (Part 1)
- Building a simple inductance meter (Part 2)
- Building a simple inductance meter (Part 1)
- Project No.5 Upgrading the counter to 4-digits
- Project No.4 Making a push-up counter
- Project No.3 Making an Up/Down counter (Part 3)
- Project No.2 Making an Up/Down counter (Part 2)
- Project No.1 Making an Up/Down counter (Part 1)