


Technical Trivia by Dr. FB
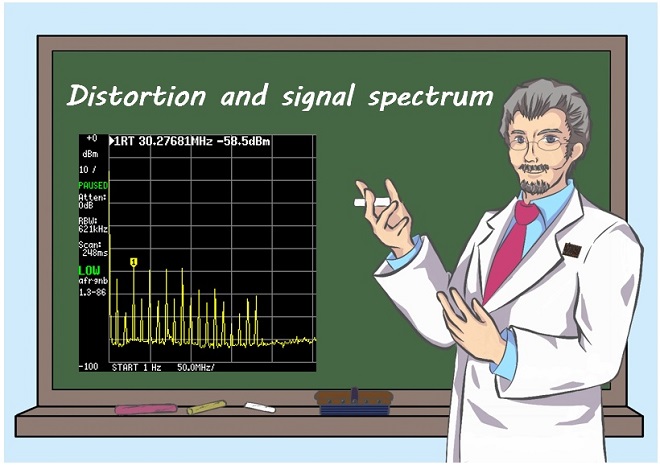
Distorted waveform spectrum as observed on a tinySA
Dr. FB
Observation of the output waveform of a 10 MHz crystal oscillator
Measuring instruments have become much less expensive than in the past. However, network analyzers used to check the characteristics of filters and spectrum analyzers used to check spurious signals in radios are still too expensive for people who are interested in electronics projects. Now, electronics enthusiasts can obtain reasonably high-performance net analyzers and spectrum scopes for only a few tens of dollars. This time I will use tinySA shown in Figure 1, an ultra-compact spectrum analyzer to observe the spectrum of the oscillator.
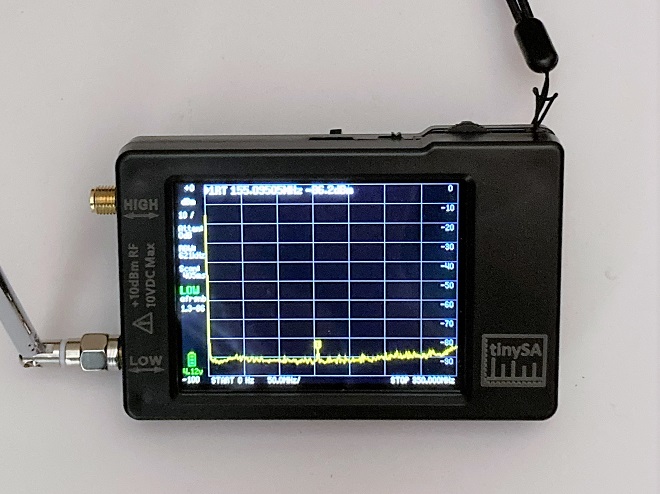
Figure 1. tinySA used in this study
In another article in this month's issue, I wrote about experimenting with and building an OCXO using a 10 MHz crystal oscillator. The crystal oscillator is a convenient component because it can output a 10 MHz signal simply by connecting its 5 V DC supply and GND. However, its output observed on an oscilloscope is unfortunately distorted, as shown in Figure 2 below.
Observing the spectrum of distorted signals
Since the output waveform of the crystal oscillator is not a clean sine wave, it can be expected that its signal contains many harmonics. This component is for clocking signals used in logic circuits, so it is unavoidable. The signal is checked with the tinySA.
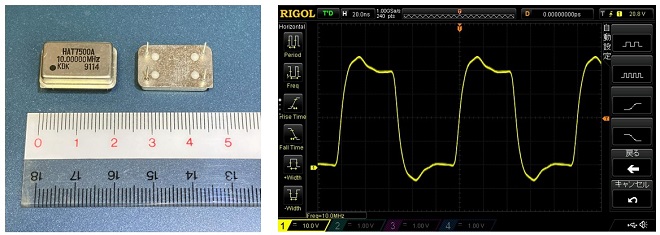
Figure 2. (Left) 10 MHz crystal oscillator, (Right) Output waveform of crystal oscillator
Since my radio shack, where the experiment is being conducted, has equipment that radiates many unwanted signals, in addition to a 10 dB external attenuator, a 30 dB attenuator is inserted inside the tinySA. This is to ensure that the signal received from the outside does not appear on the screen being used. The setup is shown in Figure 3 below. I inserted a 10 dB attenuator externally, and selected (set) the built-in 30 dB attenuator in the tinySA.
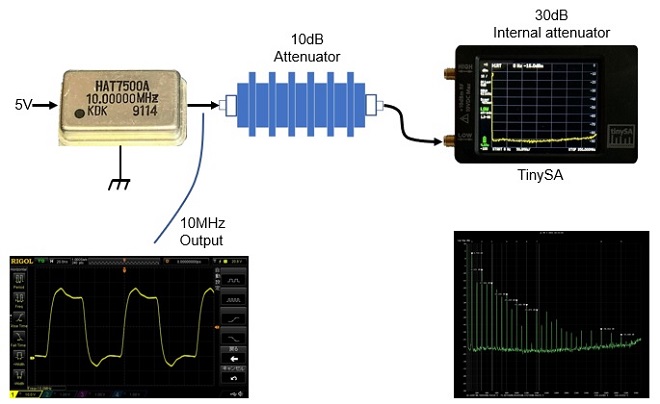
Figure 3. Observation of output signal spectrum
The spectrum of the crystal oscillator output signal observed by the tinySA is shown in Figure 4. The fundamental signal at 10 MHz is displayed on the bottom left in the figure. Third harmonics appear at a level about 6 dB lower than the fundamental signal, and unwanted signals are also present around 310 MHz at a level about 50 dB lower than the fundamental signal. The strength of the level of the odd-numbered harmonics are particularly noticeable. It can be seen that the distorted waveform contains a large number of harmonics.
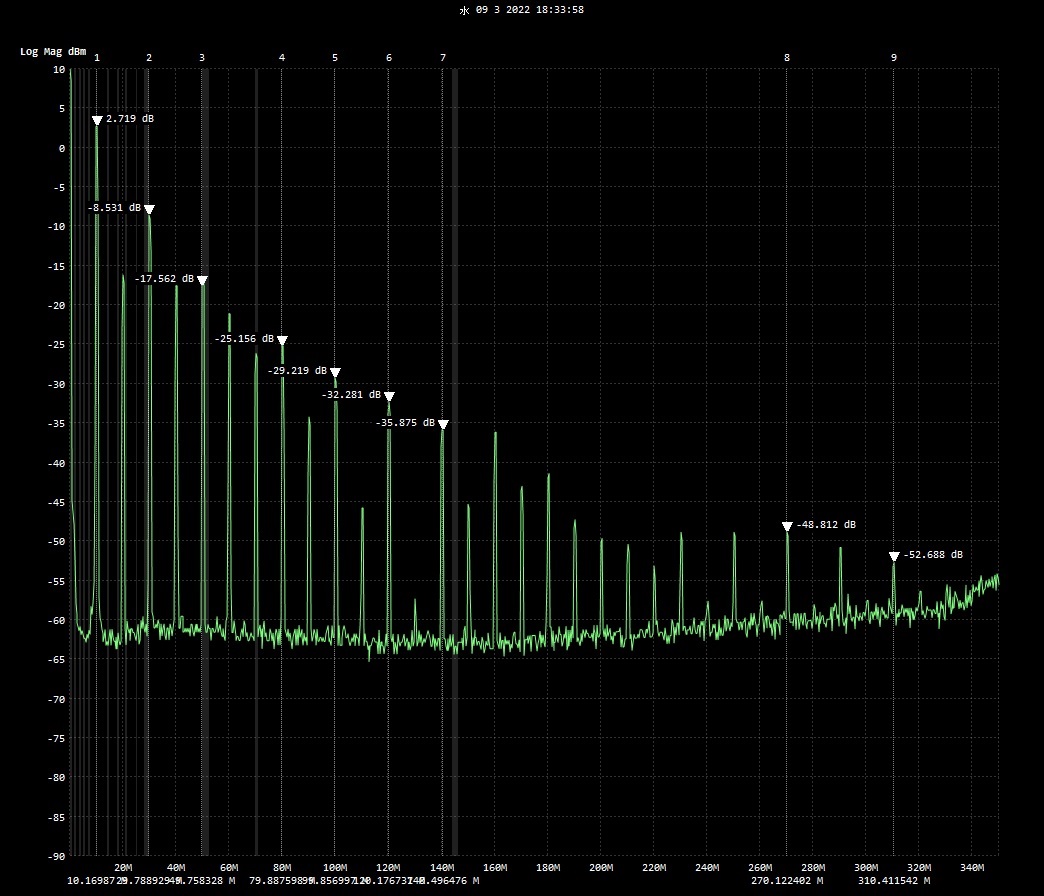
Figure 4. Spectrum of the 10 MHz crystal oscillator
Aiming for a clean sine wave signal by inserting a filter
We know that the output waveform of the crystal oscillator contains many harmonics, as shown in the signal spectrum in Figure 4. Therefore, I tried to remove harmonics other than the desired ones by inserting a LPF (Low Pass Filter), BEF (Band Elimination Filter), and BPF (Band Pass Filter), and visually observed how each filter affects the removal of harmonics with the tinySA. The most effective filter for removing harmonics was when a BPF and BEF were inserted in series.
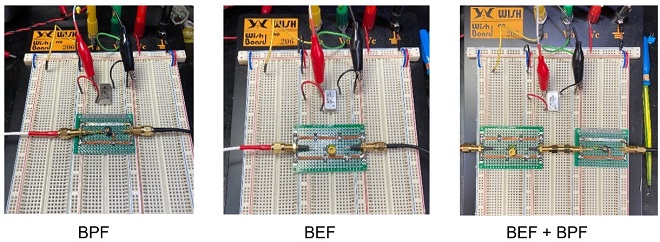
Figure 5. Experiment with filter inserted
Confirming the effect of the filter
Figure 6 shows the respective output waveforms observed when the filter is connected to a crystal oscillator.
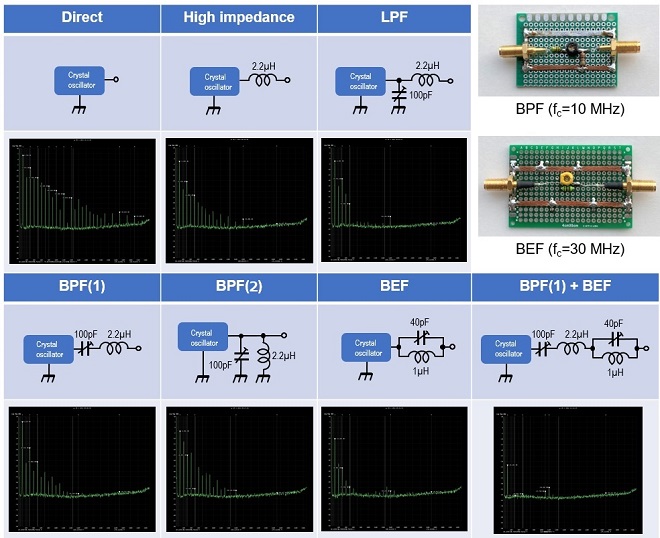
Figure 6. Checking the effects of various filters with the tinySA(Click on each waveform to enlarge)
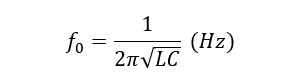
ŌĆ£High impedanceŌĆØ shown in the top row of Figure 6 (Table) means that a coil has a reactance of XL=2ŽĆfL against high frequency, so I simply inserted only the coil to see the effect of reactance. The trimmer capacitor was adjusted and set to the best position. Therefore, the exact capacitance of the capacitor was not known. fc (cut off frequency) of the BPF and BEF explained below is calculated by the following well-known formula to find the resonance frequency fo. In all cases, the trimmer capacitor was set to the best position.
Even if a BPF is inserted, unwanted signals other than 10 MHz are also output, as you can see in the screen image in Figure 6 above. If you observe that waveform image with an oscilloscope, it looks like a sine wave, but the signal waveform is still distorted. (Figure 7 Right)
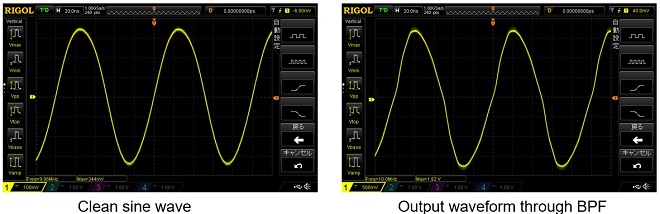
Figure 7. Comparison of waveforms when BPF is inserted in SG and crystal oscillator
Then, a BEF was inserted to remove the harmonics of 30 MHz, which were three times higher than the fundamental signal. Unwanted signals above 60 MHz were largely eliminated, but signals below that level were still present at high levels.
Next, I connected the BPF and BEF in series to check their effects. There were still unwanted signals at 100 MHz and 120 MHz, but the rest of the signals were largely cut by the filter, indicating a much cleaner signal.
Conclusion
I could confirm that a simple filter insertion cuts unwanted signals to a large extent. Figure 8 compares the output waveforms of the original crystal oscillator output with those of a BPF and BEF connected in series. The yellow trace shows the original output waveform, and the blue trace shows the waveform when the BPF and BEF are serially inserted.
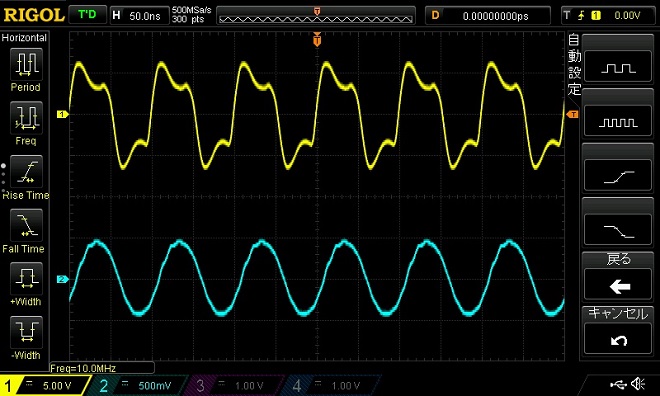
Figure 8. Comparison of output waveforms
It is not clear how much cleaner this filter can be inserted into the output of the 10 MHz reference signal generator shown in another article, but you will notice that it is closer to a sine wave as far as observation with an oscilloscope is concerned.
FBDX
Technical Trivia by Dr. FBŃĆĆbacknumber
- Generating ŌĆ£Sawtooth WavesŌĆØ using a D/A conversion circuit and a counter IC
- Examining a D/A converter using a Resistor Ladder
- Electronic firefly and its circuit description
- Controlling the rotation speed of a DC motor
- Description of up-down counter using 74HC192 and 74HC4511 ICs
- Considerations when making a dual voltage power supply for operational amplifiers
- Observing filter characteristics with a white noise generator
- Is noise actually reduced in twisted pair cables?
- Experiments on divider circuits using a 74HC74
- Consideration of using a photocoupler as a voltage-variable resistor
- Distorted waveform spectrum as observed on a tinySA
- Trial making of a QFH antenna
- About the inductance of coils
- Operation of analog switches
- Small digital voltmeter, 2-wire type / 3-wire type. What is the difference?
- Constant current circuit using an Op-Amp
- Coaxial cable loss to UHF and SHF
- 2.4 GHz Wireless LAN Antenna
- Let’s use MOSFETS
- 25th Comparator
- The principle of PLL
- Examination of the MLA performance
- About the Fresnel zone of the SHF band
- Level difference under open and load ends of an SSG
- Is “Made in Japan” alive? (UHF adapter again)
- Possibility experiment of passive repeater with the Back-to-Back antenna
- Why you should make SWR measurements just below the antenna!
- How reliable is the L-type BNC?
- Is the Bird 43 accurate enough?
- Does a wire dipole antenna need a balun?
- Why we donŌĆÖt use a silicon diode in a crystal radio?
- How to light the 7-segment LED
- Measurement of Antenna Performance on Handheld Transceivers (Part 3)
- Measurement of Antenna SWR on Handheld transceivers (Part 2)
- Measurement of Antenna SWR on Handheld transceivers(Part 1)
- An SWR meter
- V/UHF 3-Band Antenna Dismantling Note